In this final post of the series, we will investigate the result of a real world experiment and discuss what the results meant to the roadmap of this project.
So far we have talked about working with Optimizely Fullstack from a development perspective and integrating with a Commerce application. Then we configured and coded our first experiment in a few lines of code.
A Real World Experiment
Just like the Experiment we have talked through setting up in this series, we ran an experiment for an E-Commerce website to determine the optimal Sort Order for category pages.
This websites category pages defaulted to display Newest products first. The theory was that customer interact with this website to purchase new release products.
However there was a hypothesis that:
If customers view products on category pages with Best Selling products first, the following success criteria will be proven:
- Customers will click to view more products
- Average Order Value will increase
- Revenue will increase
Real World Results
With Event Tracking enabled as discussed in the previous posts in the series, Optimizely provided us with the following results on each of our success criteria.
Overall Results
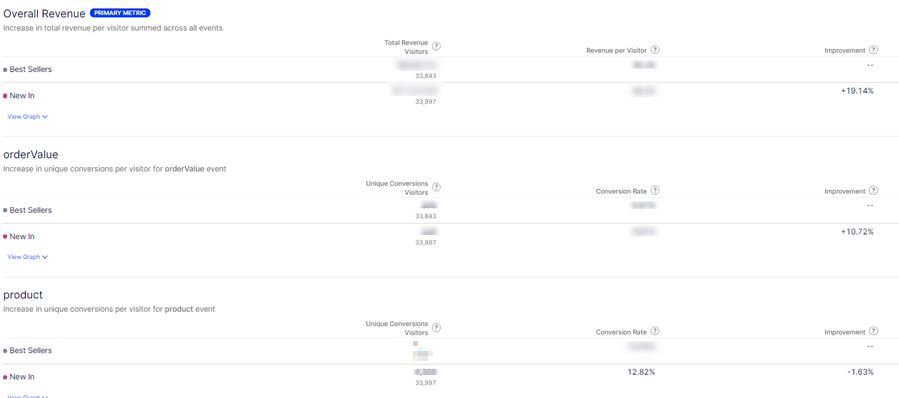
We rolled the experiment out to just 10% of total sessions. Even with a low percentage we began to see interesting trends.
At this early point in the Experiment, Customers who were served Best Sellers by default:
- Were as likely to click through to view a product details page on either New or Best selling products. No notable difference
- Had an Average Order Value 10% behind New Products
- Were 19% behind on generating revenue
Of course you need much more sessions and to run the experiment over a longer period of time for the result to achieve significance but these early findings were interesting.
It showed the original hypothesis for the Experiment was likely wrong. The Experiment was failing – and that in itself was a game changer.
What else did we find out
Using Optimizely Reports, you can refine your Results by any Audience Attribute.

Refining the reports per language and/or market showed that some Markets had a huge preference for New products. It didn’t seem to matter for other Markets where the difference was insignifant.
Another game changer. We need to refine and improve our algorithms to best serve products to users of different markets.
And how do we do that?
- We are going to create our hypothesis for what customers prefer in each market based on analytics and experimentation results
- We are going to run experiments for each market as we work through a program of experimentation, analysis and continued optimisation.
And this is just for the Category page sort order!
Conclusions
Starting is Low Cost & Easy!
Sign Up for a Free Rollout Accounts.
Use the code bases discussed in this series to get started really quickly.
Start with a simple experiment.
1 Experiment leads to many more
We picked a simple Experiment – Sort Order on Category pages. From that experiment came data on customer behaviour.
From that data came questions. A big finding was that customers seem to have quite different expectations across markets.
Let’s run more targeted experiments to find out more on this…
We should also run experiments on all key functionality as we continue to optimise conversions.
Strategic Process Changes
Well designed Experiments are a low cost way of validating assumptions around how your customers interact either with the current site or may interact with new features being thought up.
Run simple Experiments with MVP implementations to prove value before proceeding with full delivery of an expensive feature. Failed experiments are valuable. This ensures budget is used effectively.
Also Experiment to optimise existing user journeys and functionality to hit the sweet spot across all segments of users. And then continue to measure. It is guaranteed that sweet spots will move over time.

One thought on “My Experience with Optimizely Fullstack (via Rollouts) – 4 of 4”